
You glance at the airport's posted security wait time, see "12 minutes," and feel relieved. Then you spend 45 minutes in line. Sound familiar? Learning how to interpret airport security reports correctly is one of the most underrated travel skills you can develop. The numbers airports and apps display are not always what they seem, and misreading them is how travelers miss flights. This guide breaks down exactly what those reports measure, where the gaps are, and how you can use that knowledge to plan smarter every single time you fly.
Table of Contents
- Key takeaways
- What airport security reports actually measure
- Tools and technologies that generate security wait data
- How to interpret security reports for your specific flight
- Common misreading mistakes and how to avoid them
- What you gain from reading security reports correctly
- My take on security data and travel wisdom
- Plan smarter with Tsalinecheck's live security data
- FAQ
Key takeaways
| Point | Details |
|---|---|
| Posted times start late | Wait times begin at checkpoint queue entry, not the back of the overflow line. |
| Terminal data beats averages | Checkpoint-level data reveals threefold differences that airport-wide averages hide. |
| Treat posted times as minimums | During peak hours or staffing shortages, actual wait can be double the posted figure. |
| Cross-verify your sources | Combine official airport data, traveler apps, and live trackers for the most accurate picture. |
| Real-time monitoring matters | Wait times can spike from 20 to 90 minutes within a single hour due to staff callouts. |
What airport security reports actually measure
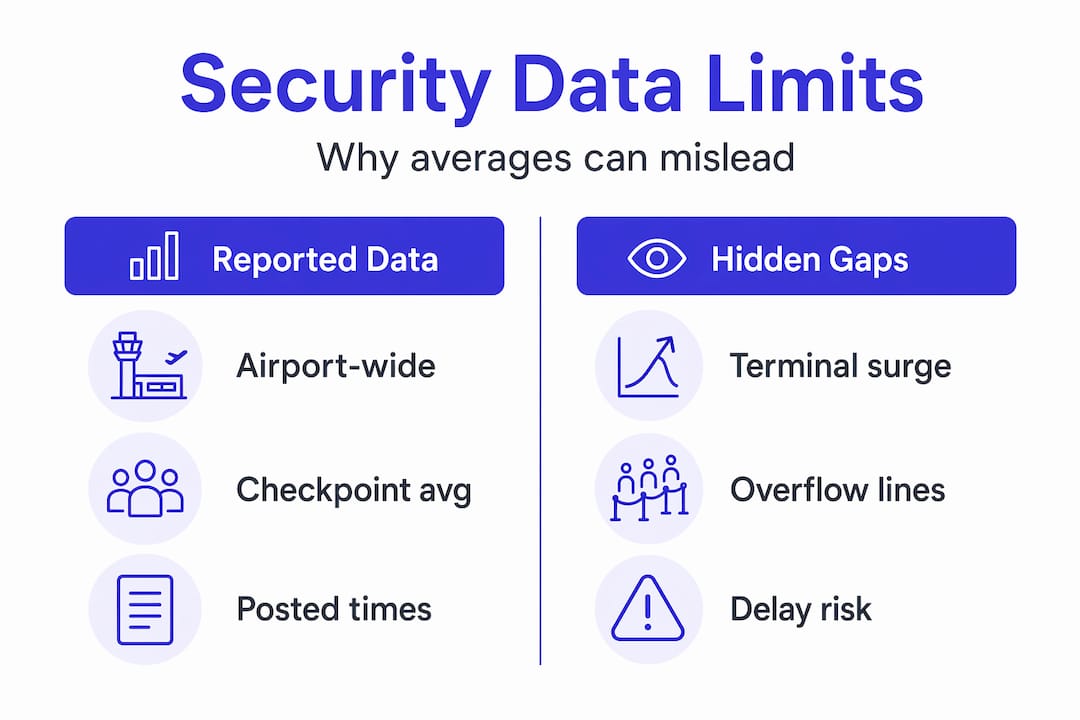
Most travelers assume a posted wait time is the total time from the back of the line to the security exit. It is not. Posted TSA wait times measure time starting specifically at the checkpoint queue entry, not the back of the overflow line or the moment you join the crowd in the terminal hallway.
LaGuardia Airport makes this explicit in its own documentation: the clock starts at the formal queue entry point. If you are standing in an overflow line that stretches 200 yards back into the terminal, that time is simply not counted. During peak hours or staffing shortages, posted wait times can represent as little as 50% of your actual total wait, because the overflow portion is invisible to the measurement system.
There are other exclusions worth knowing:
- Document check time (the moment an officer reviews your ID before you even enter the formal queue) is rarely included
- Walking time between your gate area and the checkpoint is never factored in
- Time spent reorganizing bags after the X-ray is not counted in most systems
Another critical limitation: airport-wide averages can completely mask what is happening at your specific terminal. Terminals at O'Hare, Fort Lauderdale, and Philadelphia show vastly differing wait times and officer staffing, sometimes with threefold differences between terminals at the same airport. If you are flying out of O'Hare Terminal 3, the average wait time for the entire airport tells you almost nothing useful.
Pro Tip: Always add at least 15 to 20 minutes to any posted security wait time as a baseline buffer for overflow and document check time. During spring break or holiday travel, double the posted figure.
Tools and technologies that generate security wait data
Understanding where wait time data comes from helps you judge how much to trust it. There are three main sources: airport-installed sensors, traveler-reported apps, and third-party aggregators.
Airport-installed sensors
Airports use overhead cameras and infrared sensors to count passengers moving through defined measurement points. These systems are reasonably accurate within the formal queue, but they only capture what they are programmed to measure. The measurement point is set at the checkpoint entry, which is why overflow lines go uncounted.
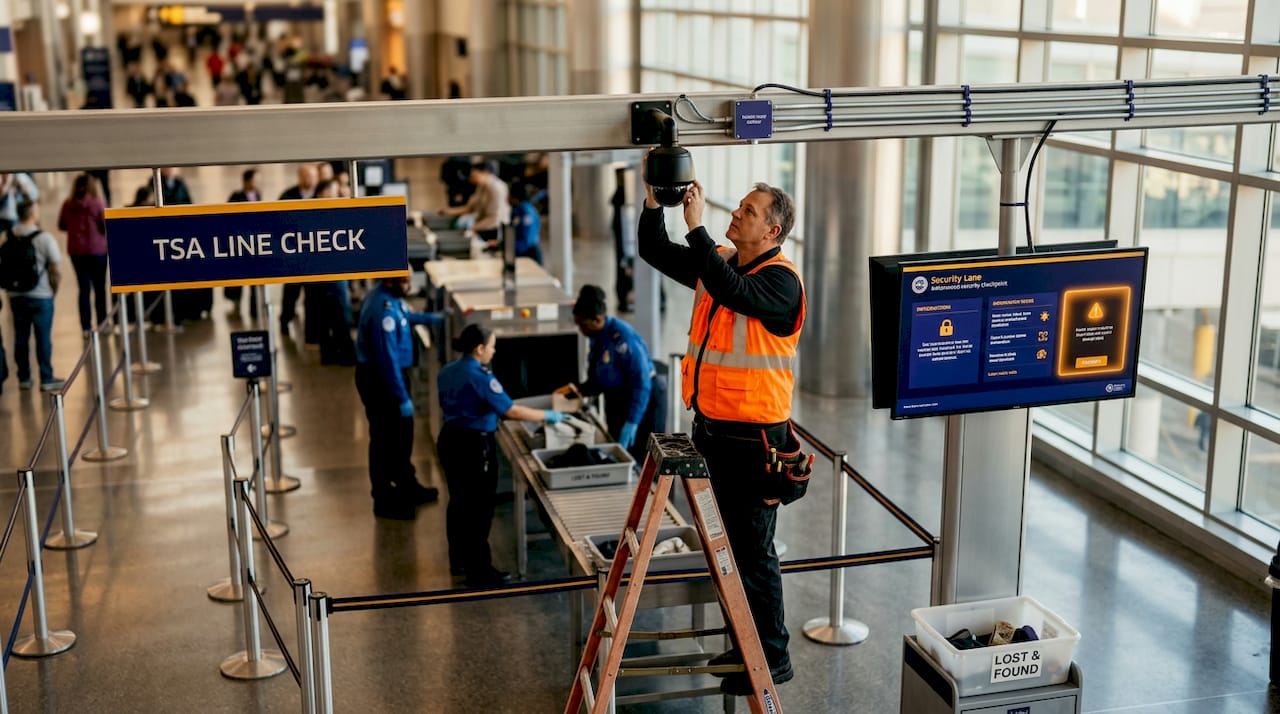
New screening technology is improving throughput and data accuracy. 3D CT scanners and biometric tokens have improved screening efficiency, compressing ID check duration to as little as 3.8 seconds per person. Faster processing means shorter queues, but it also means the data reflects a moving target as airports adopt new tech at different rates.
Traveler-reported apps
Apps like MyTSA let passengers submit real-time wait reports, which sounds helpful. The problem is reliability. Traveler-reported apps can have update delays and may show outdated or incomplete information during staffing crises, precisely when you need accurate data most. Fewer observers submit reports when lines are chaotic, creating a lag at the worst possible time.
Third-party live trackers
Some independent developers pull data directly from airport APIs where available. Many airports do not provide live wait-time estimates or periodically remove them when unreliable, making third-party trackers that aggregate checkpoint data valuable for real-time insights. These tools fill a real gap, but their coverage varies significantly by airport and terminal.
Here is a quick comparison of the three data source types:
| Source | Strengths | Weaknesses |
|---|---|---|
| Airport sensors | Official, consistent methodology | Excludes overflow, terminal-specific gaps |
| Traveler apps (e.g., MyTSA) | Real-time crowd input | Delayed updates, low volume during crises |
| Third-party trackers | Aggregates multiple data points | Coverage varies by airport |
Pro Tip: For the most reliable picture, check at least two sources before leaving for the airport. An official airport estimate combined with a live third-party tracker gives you a much better read than either source alone.
How to interpret security reports for your specific flight
Airport security analysis techniques work best when you apply them to your exact situation, not to the airport as a whole. Here is a step-by-step process you can use before every flight.
-
Identify your departing terminal and checkpoint. Do not look up general airport wait times. Find the specific terminal and checkpoint number for your flight. Airlines like Delta, United, and American often operate from dedicated terminals, and the security experience can differ dramatically between them.
-
Check the latest data from multiple sources. Pull up the official airport website, a live tracker, and a traveler app simultaneously. Look for agreement between sources. If all three show 25 minutes, that is a solid signal. If they disagree significantly, lean toward the higher number.
-
Add buffer time for overflow and walking. Use the posted time as a floor, not a ceiling. Add 15 to 20 minutes minimum for overflow queuing and document checks. Add extra walking time if your gate is far from the checkpoint.
-
Look at historical trends for your time slot. Many trackers show patterns by day of week and time of day. A Tuesday morning departure at 6 a.m. behaves very differently from a Friday afternoon flight at 5 p.m. Use that pattern data to set your expectations.
-
Factor in TSA PreCheck or CLEAR if you have them. Expedited lanes like TSA PreCheck process roughly twice as many passengers per hour compared to standard lanes, offering more predictable wait times. If you are enrolled, your wait time interpretation changes significantly.
-
Monitor for sudden changes on travel day. A checkpoint showing 20 minutes at 6 a.m. can balloon to 90 minutes by 7 a.m. due to officer callouts. Check your sources again within 30 to 60 minutes of leaving for the airport, not just the night before.
-
Adjust for known disruptions. During government shutdowns, major holidays, or spring break surges, airports have advised arriving 3 to 5 hours early. Standard buffers do not apply during these periods.
Common misreading mistakes and how to avoid them
Even experienced travelers fall into these traps when reading airport security documentation. Recognizing them is half the battle.
-
Treating posted time as total time. This is the most common error. The posted figure starts at queue entry. Your actual experience begins the moment you join any line, including overflow. Always treat posted times as minimums.
-
Ignoring terminal-specific differences. Airport-wide averages are almost useless for planning. Checkpoint-level data is far more useful because terminals experience very different conditions. Always filter your search to your specific terminal.
-
Not accounting for sudden staff callouts. Security checkpoint wait times are highly volatile due to dynamic staff callouts, making real-time tracking far more reliable than static averages. A report from two hours ago may already be outdated.
-
Over-relying on a single app. No single source has complete coverage. MyTSA, airport websites, and third-party trackers each have blind spots. Cross-referencing takes two extra minutes and can save you hours.
-
Missing the connecting passenger gap. TSA data mainly reflects originating passengers and excludes connecting passengers, so throughput numbers can underestimate total airport passenger volumes. At a hub like Atlanta, this discrepancy can be significant during high-traffic periods.
-
Skipping adjustments during peak seasons. A 20-minute wait time in October at your airport may become a 75-minute reality during Thanksgiving week. Seasonal context matters when reading any security report.
What you gain from reading security reports correctly
The payoff from mastering airport safety report interpretation is concrete and immediate. The most obvious benefit is avoiding missed flights. When you know that posted times undercount real wait times, you build in the right buffer and stop cutting it close.
Beyond that, you gain time back. When you know your checkpoint will be fast, you do not need to arrive two hours early for a domestic flight. That is time you can spend at home, in the car, or at a coffee shop near the airport instead of sitting in a terminal. Travelers who understand how to analyze airport security data make smarter checkpoint choices too, like selecting a less-trafficked terminal entrance when the main checkpoint is backed up.
The stress reduction is real. Uncertainty is what makes airport security feel so unpredictable. When you understand what the numbers mean and where the gaps are, you replace anxiety with a plan.
My take on security data and travel wisdom
I've looked at a lot of airport security reports over the years, and the pattern I keep seeing is this: travelers trust the numbers too much or dismiss them entirely. Both extremes hurt you.
What I've learned is that the data is genuinely useful, but only when you understand its limits. A posted 15-minute wait at Atlanta's checkpoint is not a promise. It is a starting point for your own calculation. I've watched travelers sprint to their gates because they read a 10-minute wait time and assumed that was the whole story. It almost never is.
The technology improvements are real and worth acknowledging. Biometric verification and 3D scanning are making security faster in measurable ways. But adoption is uneven across airports, and staffing remains the wild card that no algorithm fully accounts for.
My honest advice: use every tool available, including live trackers and historical data, but build in a buffer you are comfortable with regardless of what the screen says. The traveler who arrives with 30 extra minutes and reads a book at the gate is always better off than the one who optimized perfectly on paper and ran out of runway.
— Lance
Plan smarter with Tsalinecheck's live security data
If this guide has shown you anything, it is that reading security reports well requires current, checkpoint-level data. That is exactly what Tsalinecheck delivers.
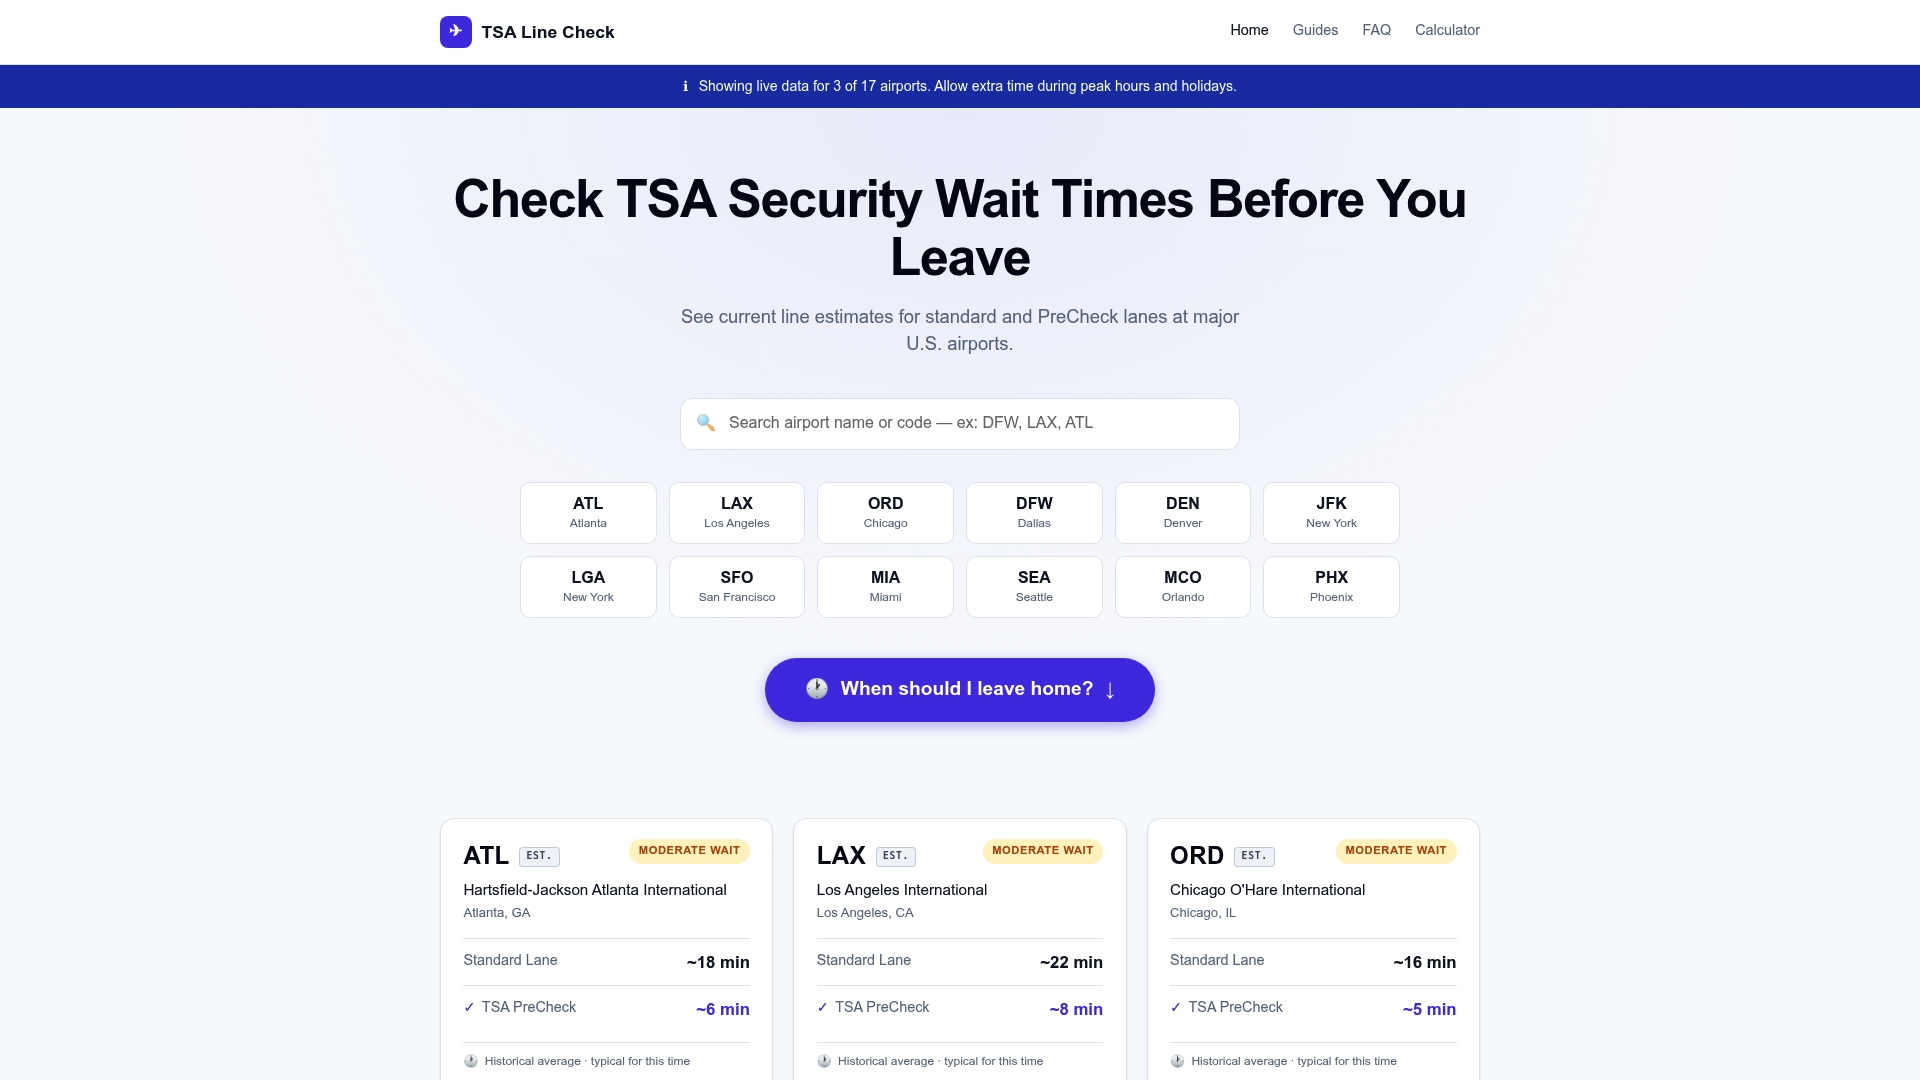
Tsalinecheck pulls real-time wait time data for major U.S. airports, giving you both standard and TSA PreCheck line estimates before you leave home. You can check live conditions at DFW right now, look up LAX wait times, or browse any major hub to see current checkpoint conditions. The platform also integrates historical patterns so you can see whether your travel window is typically fast or slow. Pair that with the interpretation skills from this guide, and you have everything you need to stop guessing and start planning with confidence.
FAQ
What does a posted TSA wait time actually measure?
Posted TSA wait times measure the time from the formal checkpoint queue entry, not from the back of any overflow line. This means the actual total wait is often longer than what is displayed, especially during busy periods.
Why do wait times vary so much between terminals?
Different terminals have different staffing levels, lane configurations, and passenger volumes. Terminals at the same airport can show threefold differences in wait times, which is why checking your specific terminal matters more than looking at an airport-wide average.
How often do security wait times change?
Wait times can change dramatically within a single hour. A checkpoint that shows 20 minutes at 6 a.m. can reach 90 minutes by 7 a.m. due to officer callouts or sudden passenger surges, making real-time monitoring on travel day a smart habit.
Can I trust traveler-reported apps for security wait times?
Traveler apps like MyTSA are useful but have known delays, particularly during staffing crises when fewer people are submitting updates. Use them as one input alongside official airport data and live third-party trackers for a more complete picture.
Does TSA PreCheck change how I should read security reports?
Yes. TSA PreCheck lanes process roughly twice as many passengers per hour as standard lanes and offer more predictable wait times. If you are enrolled, focus on PreCheck-specific wait data rather than general checkpoint figures for a more accurate estimate.